On This Page
Industry
Project Size
Small
Project Overview
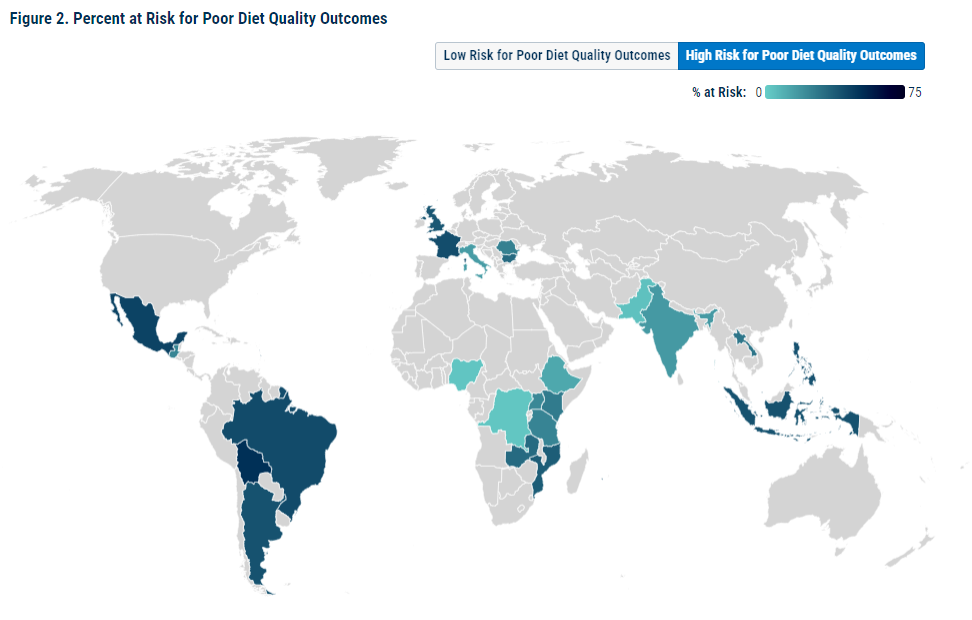
FHI 360’s Intake Center for Dietary Assessment, a leading organization in nutrition research, sought to enhance the accessibility and presentation of their dietary data by developing interactive visualizations for their website. A critical aspect of the project was the accurate handling of survey weights, ensuring that all calculations properly reflected the population representation. The goal was to transform complex nutritional datasets into user-friendly, visually appealing formats that effectively communicate insights to nutrition researchers. Project Balance was approached to automate the processing of the nutrition survey data, load it into an interactive data visualization tool called Flourish, and present the data on Intake’s website using beautiful, engaging visualizations to enhance understanding.
Solution
Project Balance collaborated closely with Intake’s nutrition experts to understand their specific requirements and objectives. Through regular consultations, we identified key data points and visualization preferences for compelling data storytelling. Leveraging Microsoft’s Power Query and Excel, Project Balance developed a custom data processing tool to automate data ingestion, cleaning, and summarization. Given the nature of the survey data, each respondent was assigned a specific “survey weight,” which was crucial in computing accurate weighted statistical measures. The automation ensured that these weighted calculations were consistently applied across all datasets. This custom data processing tool streamlines the preparation of datasets for visualization and automates the process of adding new data as more nutrition surveys are completed in new countries.
Flourish, a powerful data visualization platform was used to create interactive and engaging visualizations that seamlessly integrate into our client’s website.
Technology
- Microsoft’s Power Query and Excel: Employed for efficient data extraction, transformation, and loading (ETL) processes, enabling the handling of complex nutritional datasets.
- Flourish: Utilized to design interactive data representations, enhancing user engagement and data comprehension.
Specialization
The project required expertise in data analysis, process automation, and data visualization. Project Balance’s proficiency in these areas ensured the accurate processing of complex nutritional data and the creation of visualizations that were both informative and aligned with the client’s branding guidelines.
Impact
The implementation of interactive data visualizations significantly improved the client’s ability to present complex nutritional information in an accessible manner. This enhanced user engagement on their website and also showcased Intake’s capability to collect and analyze comprehensive nutrition data.
Project Balance designed and delivered a sustainable solution, ensuring that data processing runs offline without incurring additional technology server costs and human resources assistance. The entire data processing workflow is handled within Power Query and Excel, allowing FHI to update the nutrition data independently.


